Effective Test Automation Metrics in OutSystems

There are lots of great articles that discuss how you can do automated testing in OutSystems but the question gets to our head on how much it’s worth writing those tests. I wanted to cover in this blog on how we can get the most value out of the tests being written and what’s the right metric that works.

In general, writing automated tests means you need more time than the usual estimates you have in just developing a feature. It usually adds up 30–50% time to consider the different test cases a feature would have. This is often seen by the business differently as getting things done and releasing the product comes the top priority. This boils down to how much investment the business can do to bring up the quality of the application and help in the maintenance of it. I would compare the process in buying a car that can be diagnosed manually through trial and error vs a car that has an advanced computer box where it detects automatically which is the faulty module. In the end, you spend more on buying the advanced car but you save a lot of time in fixing the problem.

“Time is gold” as they say it. When the concept of automation is brought up to the team, the next question we always have is which codes needed tests?

Effective Test Automation Metrics in OutSystems image 1

While test coverage tells a lot about how much tests you got, it also means that investing a lot even on the uncomplex code. Likely investing in a car that automatically checks wearing out tires. Doesn’t make so much sense, right? Because it is obvious. Don’t get me wrong, this is a good metric but deviates to the real priority.

This is where I combine it with this other metric — Cyclomatic Complexity to decide whether it needs a unit test.

Effective Test Automation Metrics in OutSystems image 2
Effective Test Automation Metrics in OutSystems image 3

Cyclomatic complexity is a software metric, used to indicate the complexity of a program. — Thomas J. McCabe

Cyclomatic complexity = E — N + 2*P

where,

E = number of edges in the flow graph.

N = number of nodes in the flow graph.

P = number of connected components

Might sound complex but in OutSystems, it’s actually easy to calculate since codes are already visual. Here is an example of how to calculate this metric on a Server action

Effective Test Automation Metrics in OutSystems image 4

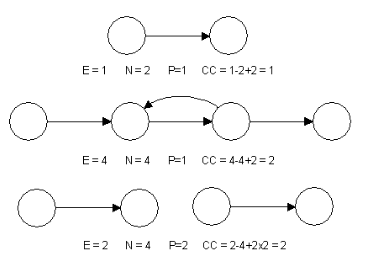
E = 19, N = 17, P = 1

Formula:

E — N + 2(P) = CC

19–17 + 2(1) = 4

The result 4 here means there are 4 scenarios present on this server action which makes it complex. My rule of thumb is to unit test when CC > 2. One other tip is that the result is an indicator of the minimum test cases you need to get good coverage. Checkpoint can be done during a code review process to pinpoint whether a code qualifies for a test and how much tests it needs.

Getting the team to be in a mindset of creating automated tests could be rough in the beginning but as they build few tests and get comfortable with it, cadence will improve and it is more incorporated within the development process. So CUT (Code and Unit Test) the chase and start writing tests!

John Salamat
Technical Lead
Connect with John on LinkedIn

A selection from our recent work